Cobalt Interlayed TiN-coated Tungsten Carbide Cutting Tool’s Performance Ⅹ
- Details
- Category: Tungsten Information
- Published on Friday, 18 September 2015 18:35
In last part, we find that as post-annealing temperature increases, the critical load value continually increased even after post-annealing at 600 °C for 2 h due to heat treatment’s improvement of adhesion property of co interlayer to the tungsten carbide substrate. Here we talk about cutting performance and reliability verification.
3.2. Cutting performance and reliability verification
In general, the wear of tungsten carbide cutting tool is a result of the load, friction and temperature between the cutting edge and the work piece. When higher cutting temperatures are reached, the cutting tool edge can easily lead to chipping and cracking. Accordingly, the wear mechanism in high-speed machining largely depends on the cutting conditions and the tool properties.
Cutting tests against AISI D2 die steel and their reliability tests were studied. In order to evaluate cutting performance of end-mill tool under high-speed cutting condition, four kinds of coating tools, TiN and TiN with Co interlayer thickness of 0.027μm, 0.08μm, and 0.15μm were evaluated. Experiments show that as the cutting times increased, the tool wear increases proportionally. As expected, the wear curve of TiN-coated tool with Co interlayer thickness of 0.027μm slightly increased. The tool life of TiN-coated tool with Co interlayer was improved to 36% compared to the TiN-coated tools. This trend seemed to be due to higher toughness, i.e. a better adhesion between coating layer and substrate.
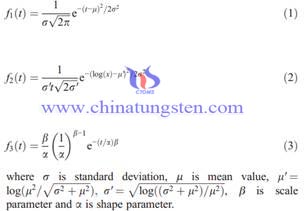
The best TiN-coated tool with Co interlayer thickness of 0.027μm was tested 18 times repeatedly until the flank wear reaches over 300μm using. The mean value and standard deviation of tool wear values are small at the initial stage of cutting but they get larger with the lapse of time. To verify the goodness of fit for tool wear distribution, the normal distribution, log-normal distribution, and the Weibull distribution, with the shape coefficient are between 0.5 and 5, were used in this work. The probability density functions of the normal distribution f1(t), log-normaldistribution f2(t), and Weibull distribution f3(t) can be expressed as follows:

Using the Minitab software (Minitab, Ver14), which is one of the general-purpose statistical computing systems, the probability density of each distribution was calculated from the experimental data for each cutting time. All experimental data were within the range of ± 3σ. The experiments were performed under the same conditions and a χ2 test verified that the tool wear distributions for each cutting time represent the distribution where the normal distributions and log-normal distributions are consistent.

(This article is totally divided into 11 parts and here is part 10, for part 9 please read: http://news.chinatungsten.com/en/tungsten-information/78776-ti-10030 )
Tungsten Carbide Manufacturer & Supplier: Chinatungsten Online - http://www.tungsten-carbide.com.cn
Tel.: 86 592 5129696; Fax: 86 592 5129797
Email:sales@chinatungsten.com
Tungsten & Molybdenum Information Bank: http://i.chinatungsten.com
Tungsten News & Tungsten Prices, 3G Version: http://3g.chinatungsten.com
Molybdenum News & Molybdenum Price: http://news.molybdenum.com.cn


 sales@chinatungsten.com